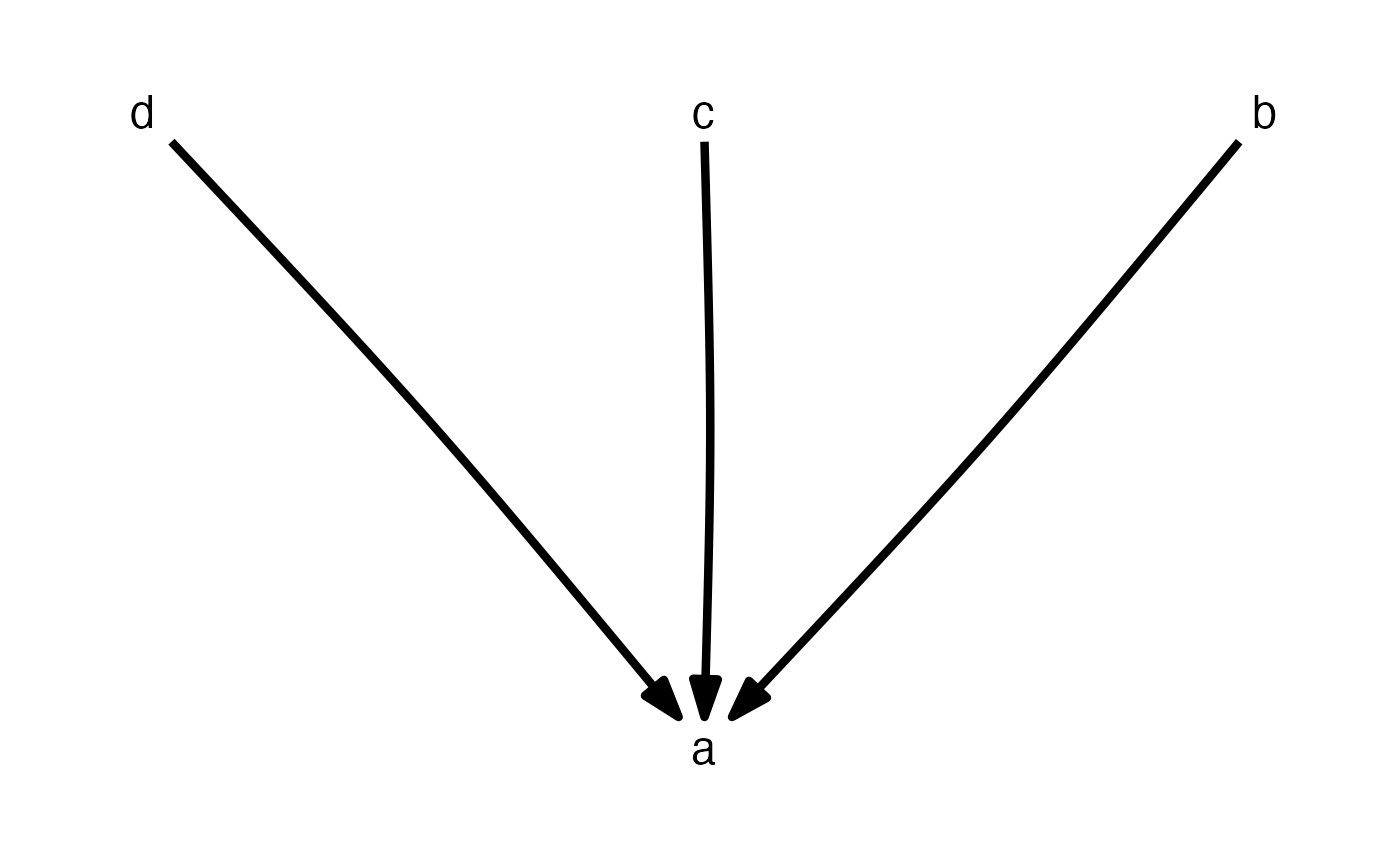
Plot a directed acyclic graph.
Arguments
- x
A `DAG`` object, usually created with the
define_model_set()orDAG()function.- labels
An optional set of labels to use for the nodes. This should be a named vector, of the form
c(var1 = "label1", var2 = "label2"). If left at `NULL``, the variable names of the DAGs are used.- algorithm
A layout algorithm from igraph, see
ggraph::create_layout(). By default, uses the Sugiyama layout algorithm, which is designed to minimize edge crossing in DAGs.- manual_layout
Alternatively, precisely define the layout yourself, by providing a
data.framethat at least has a columnnamewith all variable names, and columnsxandywith positions to be plotted. Setting this parameter overridesalgorithmbut other changes, such asrotationandflips will still be applied.- text_size
Size of the node label text.
- box_x
To avoid the arrows colliding with the nodes, specify the rectangular dimensions of an invisible box around each node. If you have long labels, you need to increase this.
- box_y
To avoid the arrows colliding with the nodes, specify the rectangular dimensions of an invisible box around each node. If you have multi-line labels, you need to increase this.
- edge_width
Width of the edges.
- curvature
Curvature of the edges. A slight curvature can look pretty.
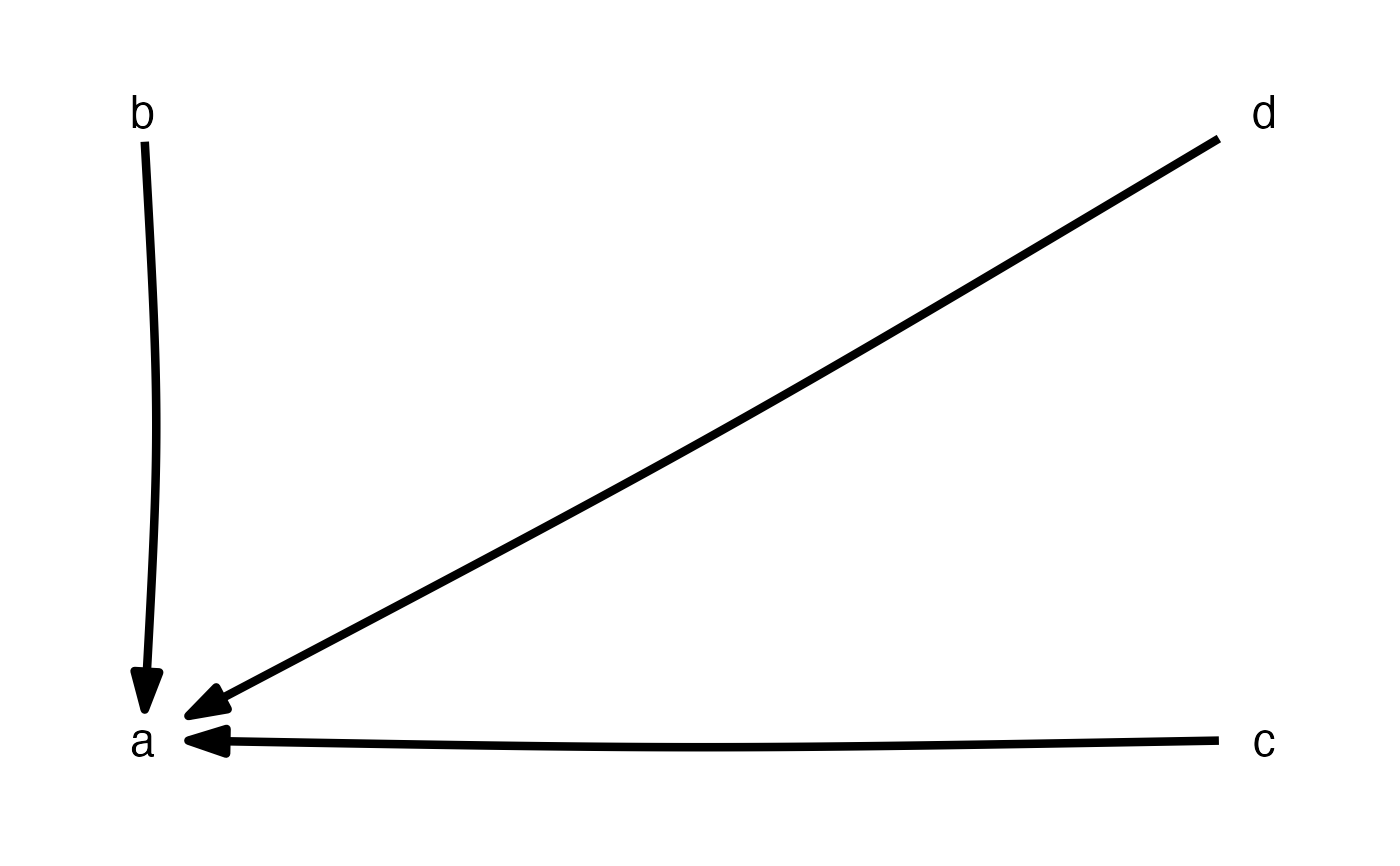
- rotation
Supply the degrees you want to rotate the layout by. This is useful in order to put rotate your upstream nodes towards the top if needed.
- flip_x
Whether to flip the node positions horizontally.
- flip_y
Whether to flip the node positions vertically.
- arrow
A
grid::arrowobject, specifying the shape and size of the arrowheads.The order of facets is taken from the ordering of the list, with the facet labels coming from the names of the list. If the list is unnamed, sequential lettering is used.
- ...
Not used.