Plot path coefficients and their confidence intervals or standard errors.
Source:R/print_and_plot.R
coef_plot.RdPlot path coefficients and their confidence intervals or standard errors.
coef_plot(
  fitted_DAG,
  error_bar = "ci",
  order_by = "default",
  from = NULL,
  to = NULL,
  reverse_order = FALSE
)
Arguments
- fitted_DAG
A fitted DAG, usually obtained by
best(),average()orest_DAG().- error_bar
Whether to use confidence intervals (
"ci") or standard errors ("se") as error bars. Will force standard errors with a message if confidence intervals are not available.- order_by
By
"default", the paths are ordered as in the the model that is supplied. Usually this is in the order that was established by[phylo_path()]for all combined graphs. This can be change to"causal"to do a reordering based on the model at hand, or to"strength"to order them by the standardized regression coefficient.- from
Only show path coefficients from these nodes. Supply as a character vector.
- to
Only show path coefficients to these nodes. Supply as a character vector.
- reverse_order
If
TRUE, the paths are plotted in reverse order. Particularly useful in combination withggplot2::coord_flip()to create horizontal versions of the plot.
Value
A ggplot object.
Examples
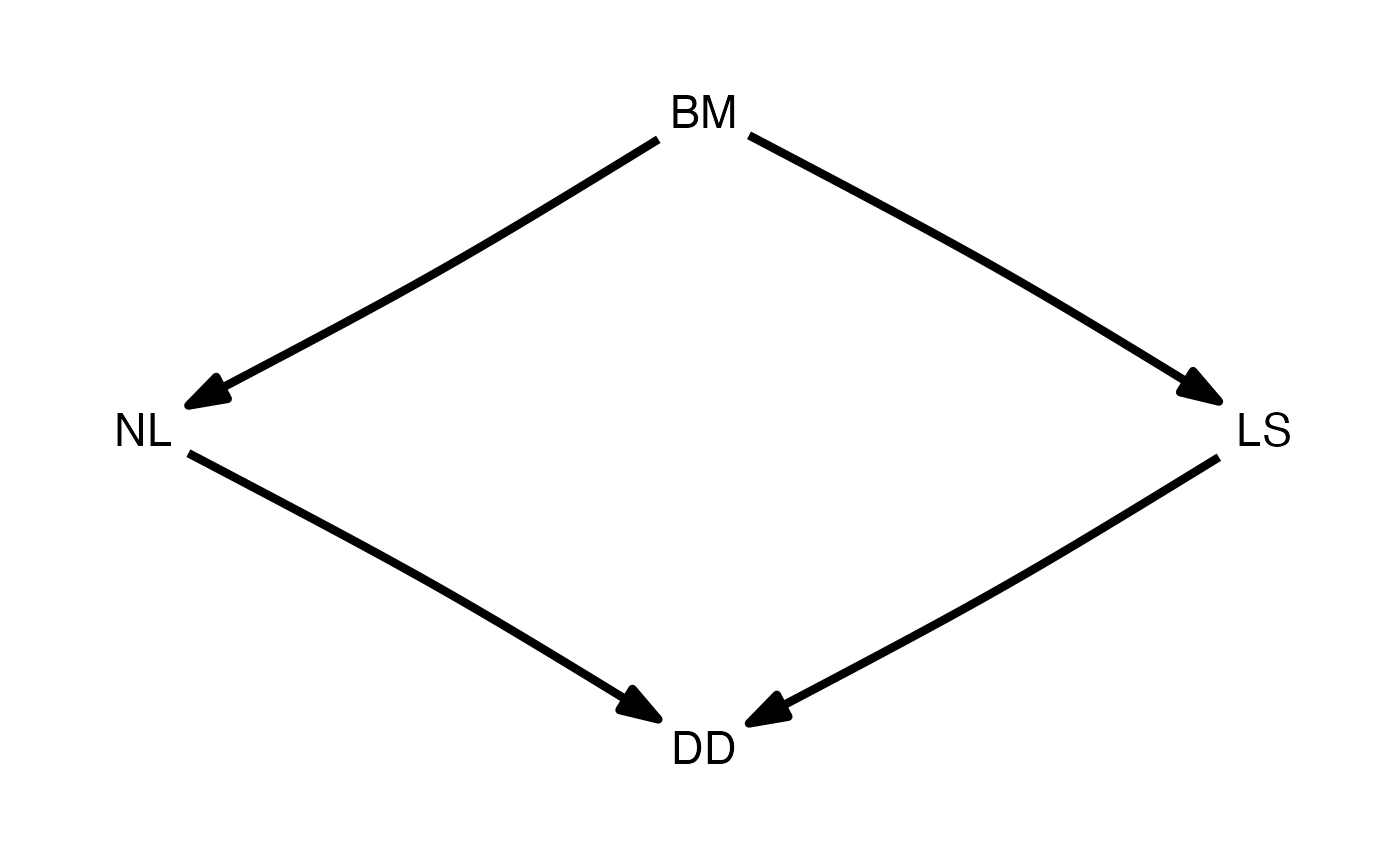
d <- DAG(LS ~ BM, NL ~ BM, DD ~ NL + LS)
plot(d)
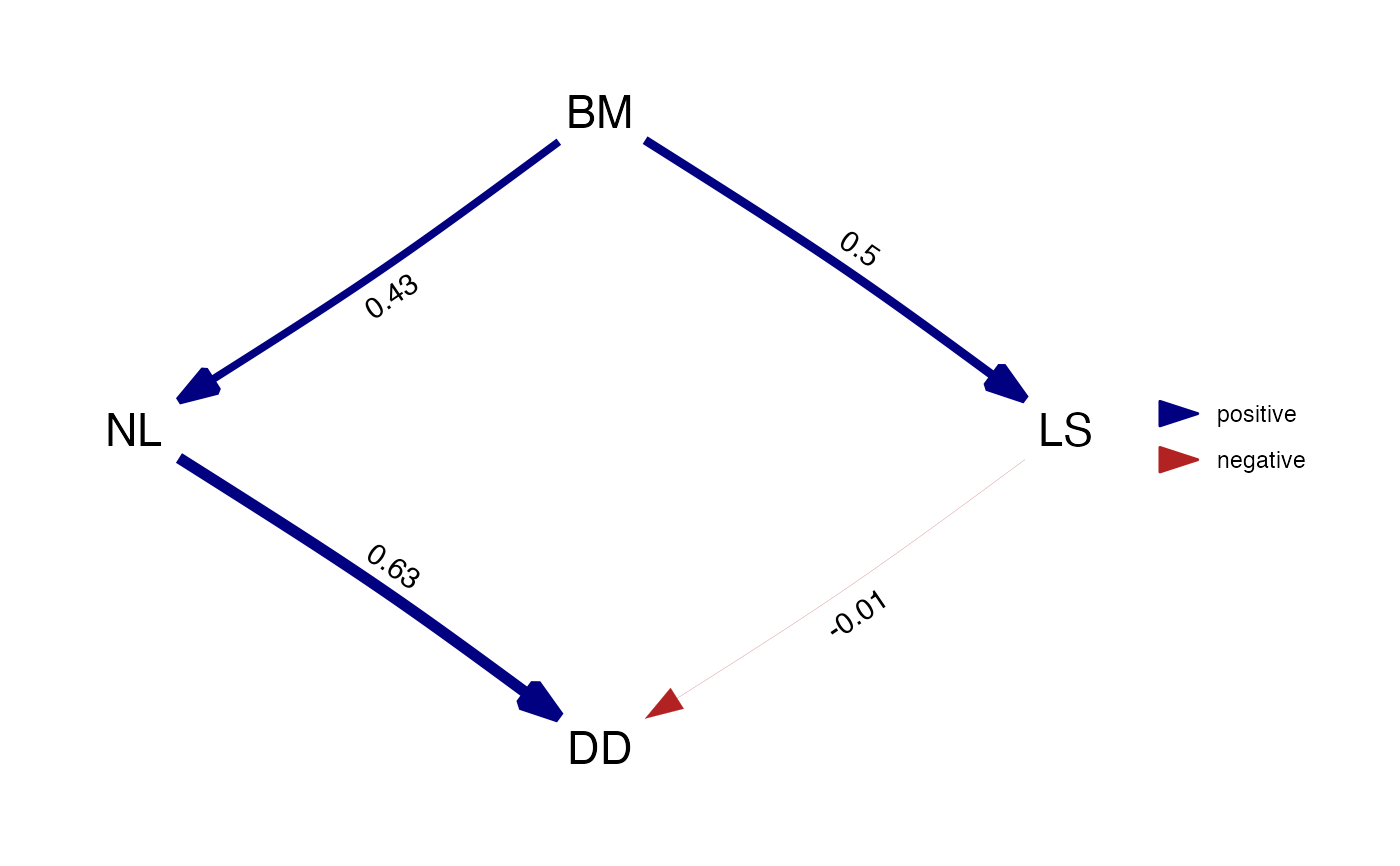
 d_fitted <- est_DAG(d, rhino, rhino_tree, 'lambda')
plot(d_fitted)
d_fitted <- est_DAG(d, rhino, rhino_tree, 'lambda')
plot(d_fitted)
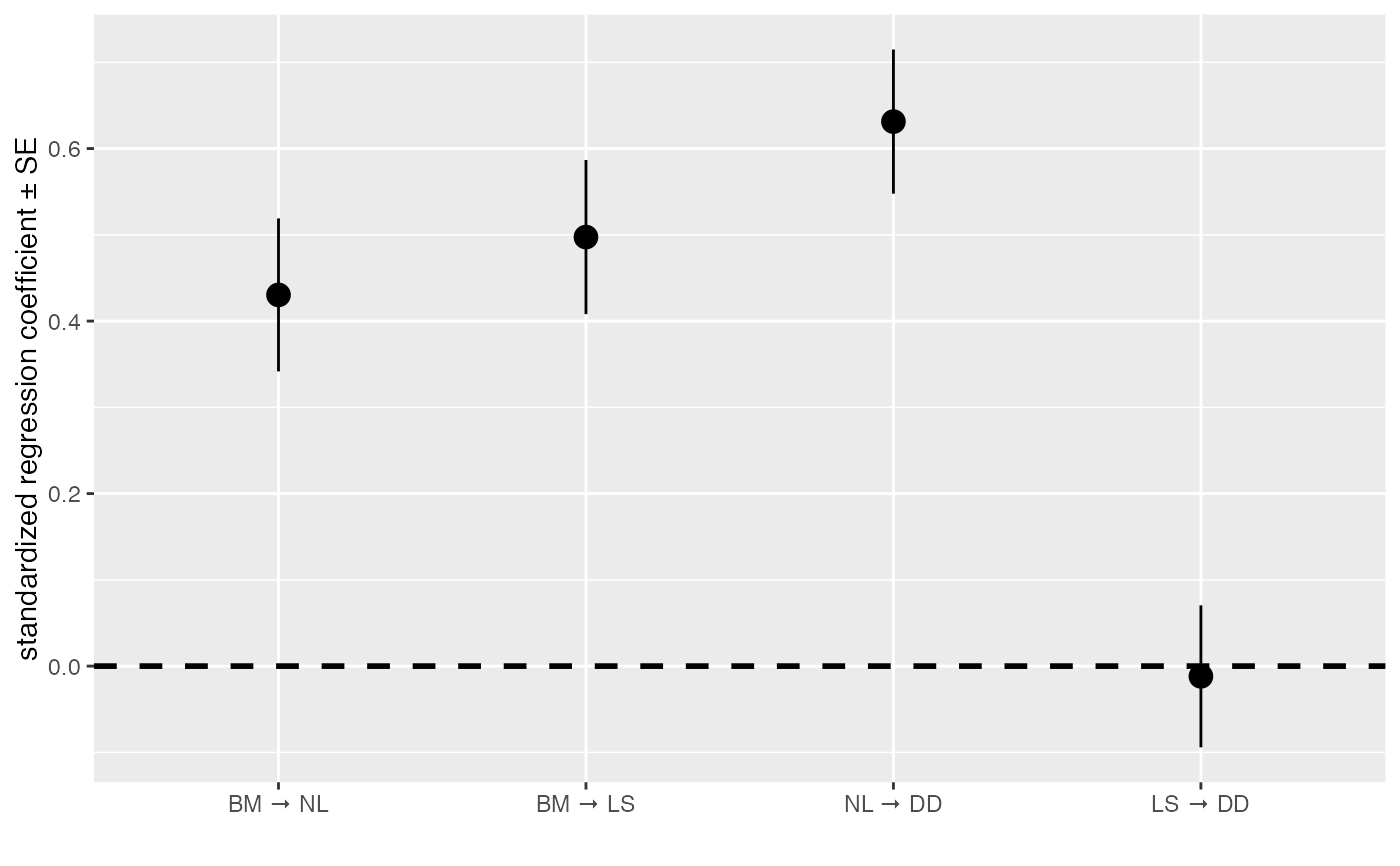
 coef_plot(d_fitted, error_bar = "se")
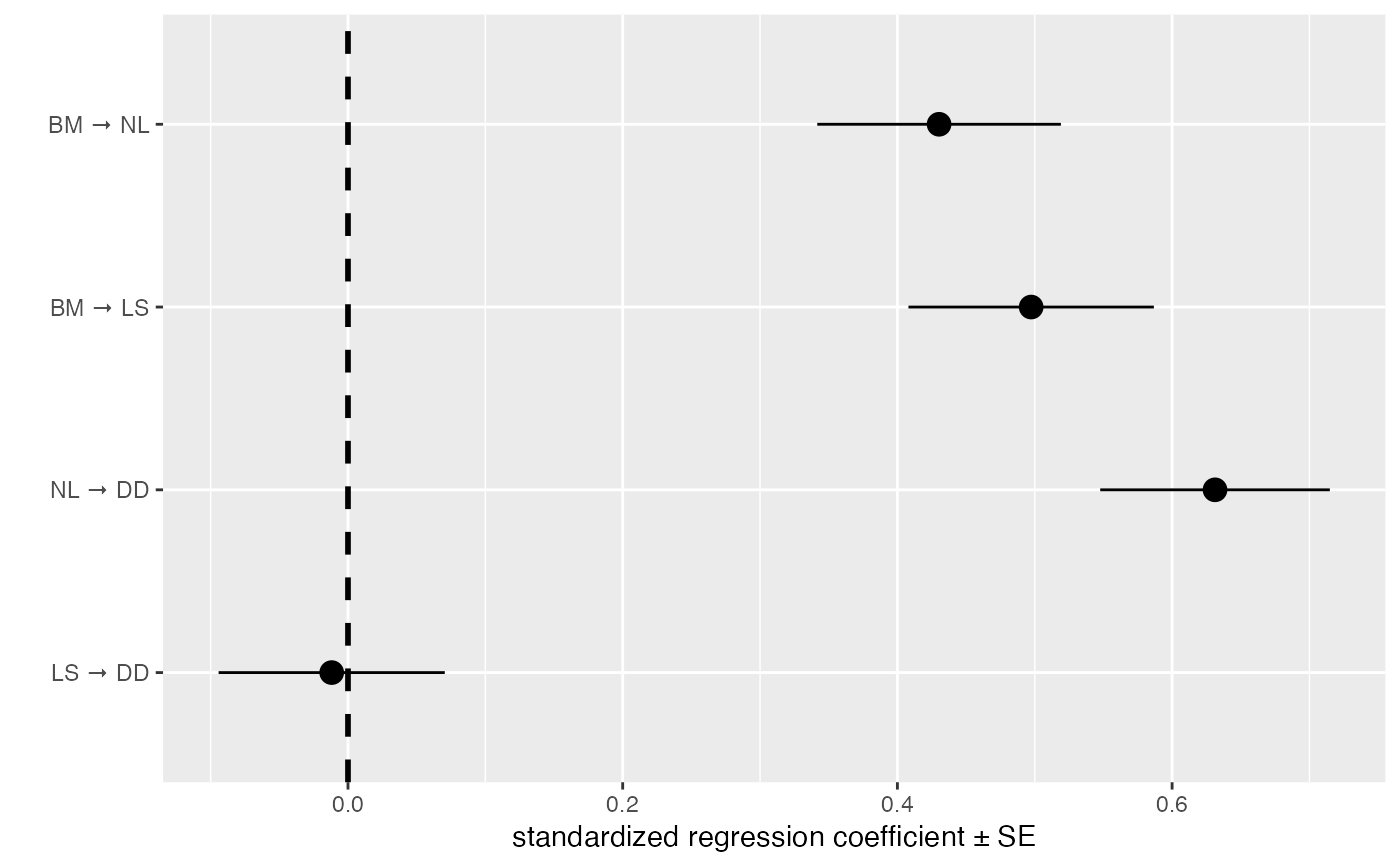
 # to create a horizontal version, use this:
coef_plot(d_fitted, error_bar = "se", reverse_order = TRUE) + ggplot2::coord_flip()
# to create a horizontal version, use this:
coef_plot(d_fitted, error_bar = "se", reverse_order = TRUE) + ggplot2::coord_flip()